Programs and Breaks Grids

Take lots of information with little effort

With iReports’ grids you get access to several grids displaying a large amount of information in a clean and easy to read way. Unlike its more cluttered counterparts, our apps grids are both flexible and ergonomic, making it ideal for daily overviews of a channel’s programs or breaks. It is even possible to compare the daily ratings with season results, through the highlighting of the program sections with different colors.

Get the Grid you need

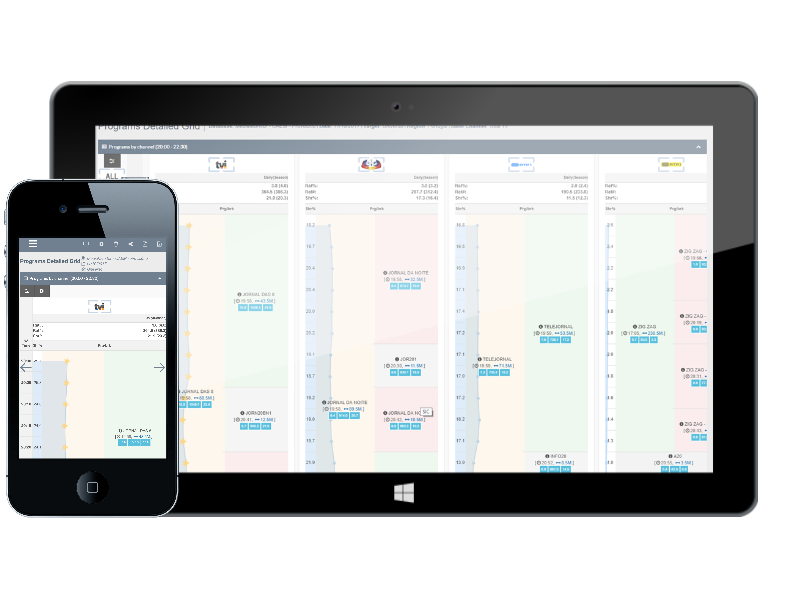
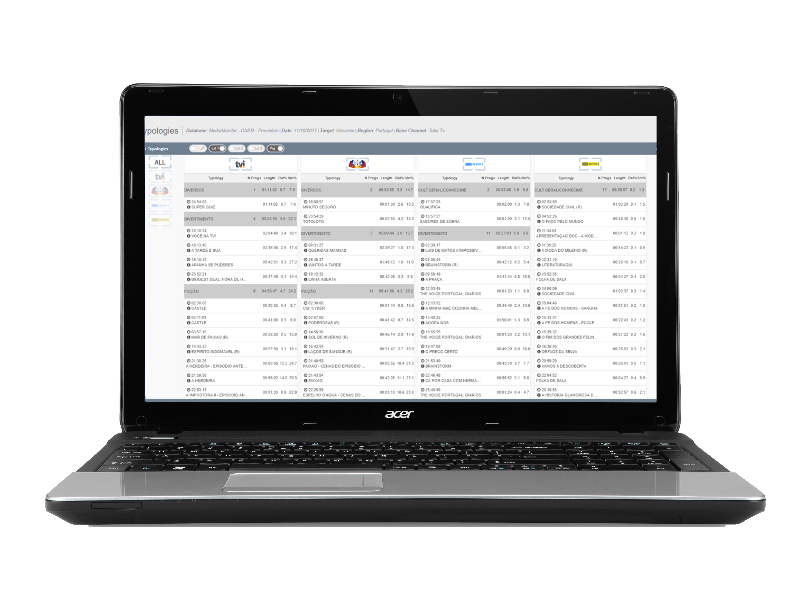
Not only can you select which period and channel you want to see, you can also compare the data with other channels or with the same channel’s past performances. Our grids are also designed to be adaptable to your needs, making it possible for you to have custom time bands, analyses on custom regions, different program genres, and much more.

Clean but Complete

In spite of their ergonomic design our apps have large amounts of information available. Through the use of color and symbols, we give you access to Share, Reach and other variables, comparisons with season results, top results for the analysed period and much more.

Get a Look